What Real Time Debugging Requires Today
Software systems aren’t simple anymore. Between microservices, distributed architectures, complex APIs, and cloud native infrastructure, even small teams might be managing countless moving parts under the hood. When something breaks, it’s not just a matter of checking a single file or catching a syntax error it’s about tracing ripple effects across components running in different environments with different rules.
Traditional debugging methods digging through logs, reproducing the error locally, skimming context less stack traces don’t cut it anymore. They’re too static. Too slow. By the time you make sense of what happened, the system has moved on or the bug’s buried itself deeper.
Teams today don’t just need more data they need better visibility. Insight needs to be real time, contextual, and actionable. That means seeing the system operate as users experience it. It means catching the weird edge case the moment it hits, not three hours later buried in a postmortem. Real time debugging isn’t a luxury anymore it’s survival.
How Dashboards Transform Debugging Workflows
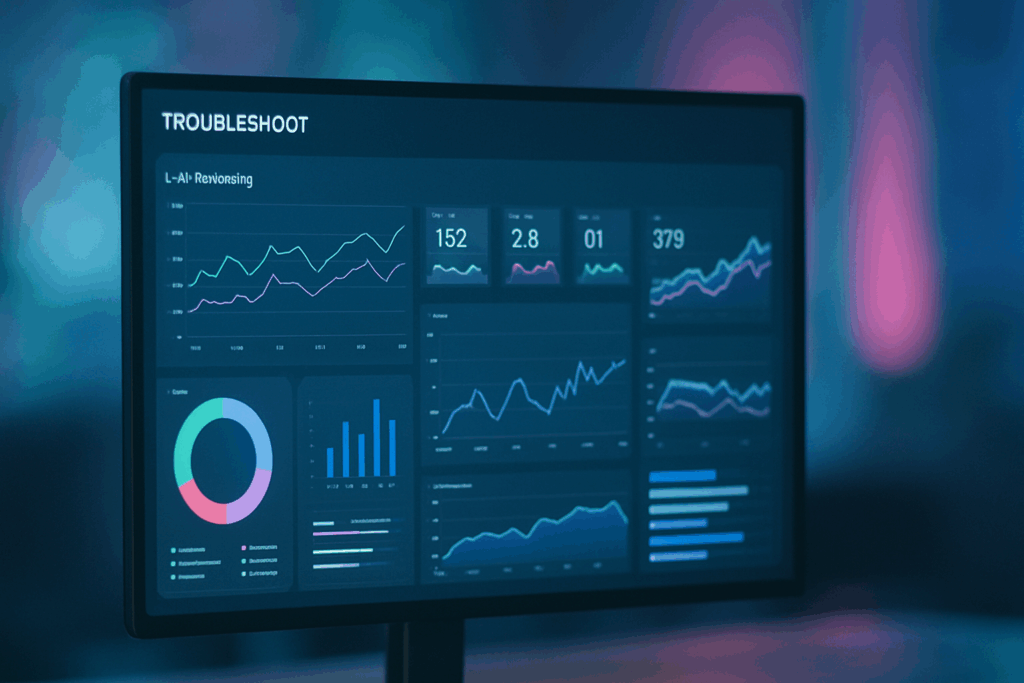
Dashboards bring scattered data into one place. Instead of hopping between the console, logs, terminal, and your IDE, you get a single, unified view of how your system is behaving right now. Not yesterday now. When something breaks, you don’t waste time digging. You spot it. You act.
Live tracking is a game changer. Variables, state changes, CPU loads, failing network calls they’re all there, updating in real time as your code runs. You can instantly see which branch was hit, how a feature flag behaved, or why a request chain stalled. This visibility narrows down the root cause fast, without blind guessing.
The value goes deeper when debugging tools integrate with your existing workflows. Pull in data from your CI/CD pipeline, tie behaviors to specific commits, link error logs to the branch that caused them. Less siloed info. Fewer dead ends. When dashboards sit at the center, they amplify how your team builds, tests, and fixes code.
Explore more on this approach here: debugging dashboards
Key Features That Power Better Debugging
Dashboards aren’t just pretty charts they’re your eyes inside a running system. Real time data streaming means you get updates the second state changes, a request fails, or a user does something unexpected. It’s not about refreshing logs it’s about a live pulse on your code’s behavior.
Conditional alerts let you set smart thresholds: flag anomalies only when they matter. No more sifting through a flood of false positives. Spot memory leaks, API timeouts, or edge case regressions before they become fire drills.
Seeing a code breakpoint in the environment context shifts debugging from abstract to actionable. Instead of bouncing back and forth between stack traces, logs, and the code base, you’re watching variables and logic unfold where they live.
Teamwork also gets a serious upgrade. Collaborative annotation means developers can drop notes, tag teammates, and align quickly. Debugging doesn’t need to happen in silos when communication is baked into the debugging tools.
Then there’s time travel debugging a fancy name for something incredibly practical. Want to see exactly how the system looked before it crashed? Go back to that moment. Rewind the state. It’s like a DVR for bugs.
This isn’t overkill. It’s control. This is the difference between chasing bugs and seeing where they live.
When to Use Dashboards vs. Traditional Tools
Not every debugging scenario calls for the same tools. Dashboards earn their keep when issues hit staging environments. Live staging means real complexity interfacing services, near production traffic, subtle config drifts. Dashboards shine here by offering a wide, real time view: metrics, logs, system health, and edge case behavior, all in one place. No flipping between ten terminals.
But when you’re squashing a deep local bug that only surfaces on your machine? Go straight to the IDE. You need step through precision, access to internal code context, and the tight feedback loop only local setup delivers.
For team debugging, dashboards bring everyone onto the same page literally. Shared dashboards create a visual, evolving source of truth. No more syncing over Slack threads or conflicting hunches. Just raw, observable state.
And when production catches fire? Use dashboards for top down triage see what’s failing, what’s trending, what needs a rollback. Then pull in logs for the forensic detail. Dashboards give the pattern; logs give the story. The combo is what gets systems back on their feet fast.
Choosing or Building Dashboards That Scale
As teams adopt real time dashboards for debugging, scalability becomes a priority. The dashboard you choose or build has to keep pace with your system’s complexity, team size, and evolving workflows.
Hosted vs. In House Solutions
Choosing between a managed solution or building your own dashboard often comes down to resources, control, and customization.
Hosted dashboards:
Faster setup with minimal infrastructure management
Often include built in integrations with common developer tools
Supported by dedicated teams for updates and security
In house dashboards:
Fully customizable to match internal toolchains and data preferences
Better control over performance and data privacy
Requires long term maintenance and dev resources
Custom Widget Support & API Integration
Scalable debugging dashboards must integrate easily with your ecosystem. This means:
Support for custom widgets that reflect your unique data types and debug needs
Flexible APIs to pull in telemetry, logs, alerts, and repository events
Modular architecture for layering new features as your stack grows
Built for High Traffic & High Complexity
In fast moving software environments, performance overhead matters. Scalable dashboards should handle:
Real time data flow from multiple concurrent sessions
Filtering and querying large data sets without performance hits
Automatic scaling during live debug sessions in staging or production
Security & Role Based Access
With debugging dashboards tied to sensitive runtime data, security can’t be an afterthought. Look for or build features such as:
Role based permissions for access to code, environments, or sessions
Authentication layers that integrate with your identity providers
Audit trails for tracking access and interaction history within the dashboard
Dive Deeper
End to end visibility is critical to modern debugging workflows. Find out what to look for and what to avoid in this breakdown on building smarter debugging dashboards:
Debugging Dashboards Guide
Final Thoughts: Control Comes from Clarity
Debugging isn’t about guessing anymore it’s about seeing. When you’ve got real time dashboards feeding you clean, live data, you cut through the noise and get to the root cause faster. No more digging through logs hoping something jumps out. You’re watching the system as it runs, and that changes everything.
Dashboards don’t replace good instincts or decades of experience they make both sharper. You still need to think like an engineer. But now, you’re equipped with tools that show you exactly how your assumptions are playing out in real time.
And the impact goes beyond just individual speed. Full stack visibility isn’t a luxury it’s a multiplier. Teams move faster. Decisions get made with context. Fixes roll out sooner. Less downtime, more trust. That’s the power of seeing clearly, and that’s why dashboards are at the center of modern debugging workflows.
 There is a specific skill involved in explaining something clearly — one that is completely separate from actually knowing the subject. Florencesa Whitelivers has both. They has spent years working with end-to-end debugging frameworks in a hands-on capacity, and an equal amount of time figuring out how to translate that experience into writing that people with different backgrounds can actually absorb and use.
Florencesa tends to approach complex subjects — End-to-End Debugging Frameworks, Digital Workflow Optimization, Core Tech Concepts and Insights being good examples — by starting with what the reader already knows, then building outward from there rather than dropping them in the deep end. It sounds like a small thing. In practice it makes a significant difference in whether someone finishes the article or abandons it halfway through. They is also good at knowing when to stop — a surprisingly underrated skill. Some writers bury useful information under so many caveats and qualifications that the point disappears. Florencesa knows where the point is and gets there without too many detours.
The practical effect of all this is that people who read Florencesa's work tend to come away actually capable of doing something with it. Not just vaguely informed — actually capable. For a writer working in end-to-end debugging frameworks, that is probably the best possible outcome, and it's the standard Florencesa holds they's own work to.
There is a specific skill involved in explaining something clearly — one that is completely separate from actually knowing the subject. Florencesa Whitelivers has both. They has spent years working with end-to-end debugging frameworks in a hands-on capacity, and an equal amount of time figuring out how to translate that experience into writing that people with different backgrounds can actually absorb and use.
Florencesa tends to approach complex subjects — End-to-End Debugging Frameworks, Digital Workflow Optimization, Core Tech Concepts and Insights being good examples — by starting with what the reader already knows, then building outward from there rather than dropping them in the deep end. It sounds like a small thing. In practice it makes a significant difference in whether someone finishes the article or abandons it halfway through. They is also good at knowing when to stop — a surprisingly underrated skill. Some writers bury useful information under so many caveats and qualifications that the point disappears. Florencesa knows where the point is and gets there without too many detours.
The practical effect of all this is that people who read Florencesa's work tend to come away actually capable of doing something with it. Not just vaguely informed — actually capable. For a writer working in end-to-end debugging frameworks, that is probably the best possible outcome, and it's the standard Florencesa holds they's own work to.